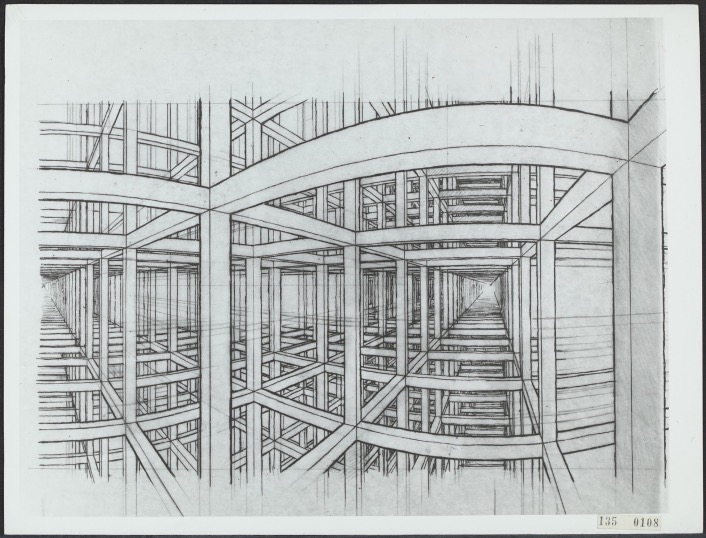
Figure 1: “Tekening”, Sketch by M.C. Escher
Image retrieved from Nationaal Archief
Mauritius Cornelis Escher, a Dutch optical illusionist known for his symmetrical tile-like images, rose to fame in the United States during the 1960s and 1970s after Martin Gardner introduced the American audience to Escher’s work.1 Escher was a powerful influence on subsequent art movements— critics argue that Escher influenced the cubist, dadaist, and surrealist movements. Additionally, several methods employed by Escher are now carried out by computer graphic processing units (GPU) on a larger scale to create animations and graphics.2 Born in Leeuwarden, Netherlands, Escher trained as an architect but then became inspired by Moorish tessellations after visiting Alhambra, Spain. He used linoleum blocks, woodcuts, and lithography (a printing process in which oils and greases create a printable image on a stone) to create mazes, impossible spaces, and other illusions.5
Using his training as an architect, Escher experimented with mathematical techniques in his drawings and prints. From the Moorish ceramic mosaics, Escher formulated the idea of “regular division of the plane” in which repeated shapes and patterns are used to cover the entire surface of the paper, leaving no negative space.5 In his images, seemingly flat objects— for example, alligators and hands— are repeated and brought out of the page with three-dimensional effects such as shading and perspective. Other drawings, such as “Waterfall”, display mathematical phenomena such as the Penrose Triangle.5,6 The Penrose Triangle, similar to a Mobius strip, is an impossible object with only one side that cannot exist in three-dimensional reality but can be configured in a sketch.
Many of Escher’s art pieces act as fractals, complex shapes with the property of the “strange attractor” in which the sides of the shape mimic the overall geometry.8 One such fractal was discovered by Benoit Mandlebrot when plotting complex numbers in the complex plane. Mandelbrot used a computer with different colored pixels to visualize trends of recursively adding zero to complex numbers.8 The results were strikingly similar to Escher’s handmade tesselations.
Mathematical visualization continues to be used today in computer animations and graphics. GPUs consist of a tessellation unit which repeats images to create detailed surfaces and textures.3 A simple geometric base surface is animated into three dimensions before being tessellated and displaced (copied and enhanced) to create a three-dimensional graphic.4 Today mathematicians utilize Bounding Volume Hierarchies (BVHS) to organize data such that GPUs balance situations of low resolution due to insufficient data with high resolution that takes up large amounts of computational power and memory.3 Computer scientists employ the iterative techniques of Escher to create digital graphics with fine details, generating the illusion of multiple dimensions. From the medieval mosaics of Alhambra to the lithograph prints of M.C.Escher to modern-day computer graphics, humans have grappled with the aesthetically pleasuring nature of infinity.
References
- Ornes, S. (2020). When Scientific American Made M. C. Escher Famous. Scientific American, 323(3), https://doi.org/10.1038/scientificamerican0920-65
- About M.C. Escher: Biography. (2020). M.C Escher.Com. https://mcescher.com/about/biography/
- Thiti Rungcharoenpaisal, & Pizzanu Kanongchaiyos. (2012). A Collision Detection Method for High Resolution Objects using Tessellation Unit on GPU. ACM SIGGRAPH 2012,1–1.https://doi.org/10.1145/2342896.2343011
- Jang, Hanyoung, & JungHyun, Han. (2012). Feature‐Preserving Displacement Mapping With Graphics Processing Unit (GPU) Tessellation. Computer Graphics Forum, 31(6), 1880–1894. https://onlinelibrary-wiley-com.dartmouth.idm.oclc.org/doi/pdfdirect/10.1111/j.1467-8659.2012.03068.x
- M.C. Escher, Life and Work. (n.d.). National Gallery of Art. https://www.nga.gov/features/slideshows/mc-escher-life-and-work.html#slide_1
- Weisstein, E. W. (n.d.). Penrose Triangle. MathWorld–A Wolfram Web Resource. https://mathworld.wolfram.com/PenroseTriangle.html
- Weisstein, E. W. (n.d.). Fractal. MathWorld–A Wolfram Web Resource. https://mathworld.wolfram.com/Fractal.htmlBriggs, J. (n.d.). The Most Famous Fractal. PBS.Org. https://www.pbs.org/wgbh/nova/fractals/set.html
- Briggs, J. (n.d.). The Most Famous Fractal. PBS.Org. https://www.pbs.org/wgbh/nova/fractals/set.html
Related Posts
The Pathway to Sonogenetics: Understanding the Mechanical Nature of the Ultrasound Stimulation Mechanism in C. Elegans
Figure 1: C. elegans in Agar under Microscope Magnification Source:...
Read MoreThe Ubiquity of the Fibonacci Numbers
Figure 1: The Fibonacci Spiral. A shape that is derivative...
Read MoreMichael Del Sesto


