
Executive Board Advisor: Nishi Jain
Co-Authors: Daniela Galvez-Cepeda, Katherine Faulkner, Sonia Fung, Alexandra McOsker, Sarah Matatov, Arooba Ahmed, Lina Lew, Maria Clara Trajano, Sreya Roy, Carolina Guerrero, Anahita Kodali, Maeen Arslan, Aadhishre Kasat

Figure 1: UV Spectroscopy is a powerful tool that’s emerging in a wide array of academic labs to characterize molecules, chemical compounds, and other materials
Source: Flickr
Introduction:
UV-Visible spectroscopy (UV-Vis) is a simple yet efficient laboratory method to determine concentration of a substance within a larger substance. A spectrophotometer, the machine that allows for this procedure, measures how much light chemical compounds absorb and records the wavelengths transmitted by the compounds, producing distinct spectra (“Principle of UV-Visible Spectroscopy,” 2020). To do this, the machine sends out a beam of light to a cuvette (a translucent container) filled with the desired substance. The cuvette absorbs only specific wavelengths depending on the concentration of the solution. The wavelengths that do not get absorbed pass through the sample, through a small opening, and are finally diffracted onto a photoluminescence detector, yielding a particular pattern that varies with each compound (What is UV Vis Spectroscopy?, 2018).
UV-Vis has several practical uses, though it is commonly considered in biological and chemical situations. Its uses vary far beyond that; for instance, one interesting application is the use of the technique to discern the period of a work of art, the materials used to produce a particular color, and even color identification for painting restoration. This non-invasive way of identifying colorants on paintings and textiles is a unique feature among spectroscopic techniques (UV-Vis Spectroscopy, Picollo et al.). In addition, environmental scientists use the spectrophotometer to model photochemical transformations of organic contaminants in water and to study air quality and climate on Earth (Noelle et al., n.d.). On a larger scale, astrophysicists use UV-Vis to get a sense of the atmospheres of different planets such as Mars and Venus (Noelle et al., n.d.).
Historical Development of UV Spectroscopy
The development and commercial launch of UV-Vis spectrophotometers was encouraged by the American government during WWII to help measure the amount of vitamins in soldiers’ food rations. The first UV-Vis devices were made commercially available in 1940. By 1941, the Beckman UV-Vis spectrophotometer promised to deliver analysis results in minutes, more agile than competing devices (Buie, 2011). Since then, many innovations can be mentioned in UV-Vis spectrophotometers history.

Figure 2: Development of UV-Vis spectrophotometers was first catalyzed by the US government in order to determine vitamin content in soldier’s food
Source: US National Archives
The following decades were marked by the mass production of UV-Vis spectrophotometers, culminating in their eventual price reduction. The first spectrophotometer to be mass produced was the Bausch & Lomb SPECTRONIC 20 UV-Vis spectrophotometer, launched in 1953 (Buie, 2011). The development of a double-beam spectrophotometer helped to speed up analysis from minutes to seconds. The Cary 14, launched commercially in 1954 by Applied Physics Corporation, delivers speed and simplicity while analyzing both sample and solvent at the same time (Buie, 2011). Huge innovation was made in UV-Vis devices in subsequent years. For example, the variable wavelength detector allowed users to change the detection levels without changing filters or lamps on the same device. Additionally, the ability for control by microprocessors, improved the processing speed and automated the devices, making them more reliable (Christy, 2017).
With the spread of personal computers (PCs) in the 1980s, UV-Vis spectrophotometers were soon able to be controlled by computers. The PC helped set storage through external software and onscreen displays. With the rise of fiber optics, UV-Vis devices were reduced in size. The advent of a new century further optimized the device: measurement of smaller volumes, reduction of stray light and noise, and the use of xenon lamps – which reduce warm up time and increases lamp life. Likewise, studies and discoveries at the turn of the twentieth century made possible the measurement of proteins and nucleic acids through UV-Vis instruments (Buie, 2011).
Figure 3: A common application of UV-Vis is to determine the optical density of cells, which can go far in determining bacterial content in samples
Source: Wikimedia Commons
Deeper Dive into UV Spectroscopy Applications
UV spectroscopy has many important applications in a variety of fields. In biological and natural science research, UV-Vis can be used to quantify the concentration of cells and proteins in a sample. One example involves using UV-Vis to measure the Optical Density (OD) of a cell culture. This technique is used in microbiology to characterize bacteria concentrations in culture media. In addition to this more classical technique, researchers have recently begun analyzing culture samples over the entire UV-Vis wavelength spectrum, giving more accurate and reproducible growth rate measurements even at low concentrations (McBirney, 2016). Another technique in biological research is the use of UV-vis for the quantification of protein concentration. This technique is used during protein expression analysis to ensure that the total protein concentration differences across samples do not interfere with experimental protein expression results. For protein quantification, several dilutions of the samples are created along with a control sample of known concentration. To the dilutions an equal amount of a special reagent (e.g., the Bradford reagent) is added that creates a color change in the samples. The intensity of the color, dependent on the amount of protein present, allows determination of protein concentration and absorbance.
UV spectroscopy also has several clinical applications. One current area of interest is the use of UV spectroscopy for tissue diagnostics. Tissues taken from a patient during a medical procedure are sent to a laboratory so that professionals can look for abnormalities; running these diagnostics are vital in many areas of medicine, from oncology to immunology to virology (Cheung et al., 2013). One technique often applied to the tissue samples is fluorescence analysis, which allows the clinicians to understand the cellular, genetic, and molecular composition of the tissues they are studying. The lasers that are used excite fluorophores; these three fluorophores are gaining popularity in oncology, neuroscience, and stem cell research. These fluorophores work well with UV spectroscopy because of their excitation wavelengths, which range from 350 to 360nm (“Ultraviolet becomes accessible”, n.d.). Because they are strongly excited by UV spectroscopy, researchers and clinicians can have a very clear picture of the tissues that they are studying, allowing them to provide patients with better diagnoses.
Spectroscopy is additionally very sensitive to many cancer biomarkers, and the absorption and scattering of light passing through the sample can be used to detect the cellular organization and structure of tumors (Brown et al., 2009). In breast cancers, UV spectroscopy can provide a non-invasive snapshot of the tumor’s environment without the need for surgery. For example, one study used spectroscopy to quantify biomarkers in carcinomas grown on mice. Optical measurements obtained from spectroscopy were compared to traditional immunohistochemical staining methods. Both methods revealed the same statistical changes in the oxygenation levels of the tumors, demonstrating that spectroscopy’s use in monitoring tumor hypoxia was on par with other methods (Brown et al., 2009). The level of absorption and scattering in UV spectroscopy can also be measured to determine whether a sample of intact breast tissue is malignant or not. Malignant breast tissue absorbs and scatters more light than benign or normal tissue. The concentration of β-carotene, often found in fatty tissue, was also found using spectroscopy to be higher in normal tissue than in those with a benign or malignant tumor (Brown et al., 2009).
Spectroscopy can be conducted inside of living organisms by inserting a fiber-optic probe via a biopsy needle to measure light scattering and absorption, blood vessel diameter, and concentrations of hemoglobin and β-carotene. These measurements help to categorize tissue as malignant or normal (Brown et al., 2009). Interestingly, one study used UV spectroscopy as a noninvasive procedure to diagnose atherosclerosis, or plaque build-up in the arteries. Two groups of rabbits were fed for the same period, one group fed a control diet of normal food and the other fed an experimental diet of cholesterol and olive oil supplemented food. Using UV-Vis on the rabbit blood, it was found that the absorbance of the rabbits fed on high cholesterol was much higher than that of rabbits fed normal food. If this same technique is applied to humans, UV-Vis spectroscopy may help to noninvasively detect the progression of atherosclerosis (Abdelhalim et al., 2013).
Among the many chemical applications of UV-Vis, the most common is determining the structure of an organic molecule. The technique can determine the presence of unsaturation in an organic compound, that is, whether it contains a double/triple bond, and the presence of a heteroatom (an atom other than carbon). How does this process work? The ultraviolet region lies from 200 nm – 400 nm, while the visible region lies from 400nm – 800nm. Organic molecules form two types of bonds: sigma (single) and pi (double/triple) bonds. Electrons in the sigma bond are tightly bound, hence they cannot jump to a higher energy level when excited by the UV-visible radiation. These electrons do not absorb UV radiation. The electrons forming pi-bonds, however, are loosely bound and can be easily promoted. The conjugated systems—which allow for the delocalization of pi electrons—lower the UV-Vis energy required for excitation, making it easier for the electrons to be promoted to a higher energy level. Thus, if a compound does not absorb UV radiation, it means that there are no pi bonds or conjugated systems present in its structure.
Enzymes are proteins that catalyze the conversion of substrates to one or more products (Cooper, 2000). The rate of enzyme activity can be calculated by measuring either the decrease in substrate concentration or the increase in the product concentration over time (Hunt, 2013). Since substrates and products differ from each other chemically and structurally, they differ in absorbances too. Hence, the progress of an enzymatic reaction can be followed by recording the changes in absorbances of the substrate(s) and product(s) over time. Since changes in absorbance are directly proportional to changes in concentration, the rate of reaction can be determined using the absorbance data, provided the absorption coefficients of the substrates are known (Schmid, 2001). Enzymatic reactions that use NADH as a cofactor (such as those involved in cellular respiration) are examples of absorbance-based enzyme assays. NADH (the reduced form) has an absorbance of approximately 340 nm, while NAD+ (the oxidized form) has no absorbance in the UV-vis region of the electromagnetic spectra. Hence, the activity of enzymes such as dehydrogenases can be measured directly by following a decreasing peak at 340 nm as a function of time (Schmid, 2001)
Ultraviolet-visible spectroscopy has important implications for environmental health and remediation efforts. Agricultural runoff and industrial waste negatively affect water quality throughout aquatic ecosystems (Chen et al., 2021). Because of the technique’s precision, efficiency, un-invasive sampling nature, and portability, many researchers utilize UV-Vis for water quality testing (Guo et al., 2020). Common pollutants found in water can absorb light of a certain wavelength (Guo et al., 2020). For instance, the characteristic spectrum for nitrate (NO3) is 223-260 nm, oxygen is 260-320 nm, and indicators of turbidity return measurements of 320-700 nm (Chen et al., 2021). By utilizing UV-Vis, water quality can be quickly and efficiently monitored around the world.
One example of UV-Vis use in wastewater management is the detection dissolved organic carbon (DOC). DOC is a common product of the carbon cycle but can impact human health nonetheless in a negative way if not monitored carefully (Guo et al., 2020). This makes studying DOC important for water quality assessments and wastewater management. In a study monitoring tropical peatlands, it was found that DOC in tropical waters could be accurately studied in remote labs through single- and two-wavelength UV-Vis techniques (Cook et al., 2017).
Figure 4: The color spectrum
Source: University of Illinois Archives
Despite its value in wastewater molecule detection, there are limitations to UV-Vis. One major issue is the water quality detection limit; there are several water pollutants that cannot be monitored by UV-Vis wavelengths including suspended solids, dissolved inorganic substances, and pathogenic microorganisms (Guo et al., 2020). In previous studies, turbidity blocked proper measurements of concentration for DOC and nitrates, and COD further hindered measurement of nitrate concentration (Chen et al., 2021).
Outside of science, UV-Vis is also a crucial tool in archeology. It has been used to identify many historical artifacts and culturally significant objects. One example is in the study of glass, where observing the complex hues of the glass are valuable to its characterization. The appearance of these objects has changed over time, which makes it difficult to visually determine their composition and original hue. But by observing the various absorption patterns, researchers can discern the mineral composition of the glass which then allows them to reconstruct the possible hue of the glass in the past. For example, one glass sample was identified to contain a specific iron ion by comparing experimental absorbance patterns to the known absorbance of this ion. The scientists then deduced that the sample may have contained iron sulfide, which would have given the sample a brownish hue.
Identification of these minerals and categorizing the hue of the glass further allow the archeologists to identify the time it was created by comparing the glass to time periods which certain compositions and hues were popular. Archaeologists have used this same principle of mineral composition and hue identification to categorize the historical period of objects containing gemstones, such as the baroque chalice in Slovenia.
Another unique application of UV-Vis spectroscopy is the historical preservation of aged artworks. Art restoration is possible with UV spectroscopy by measuring colors within a painting and matching it to an existing database of pigment materials. The spectrophotometer analyzes the painting’s wavelengths and compares it to existing wavelengths of different shades of color. One particular methodology called fiber optic reflectance spectroscopy (FORS) allows more than 2.0 μm of reflectance spectra to be recorded without causing damage to the artwork. This methodology is especially useful for discovering differences in shades that are invisible to the human eye, making accurate restoration possible. Spectroscopy can also be used to determine the origin of the painting, thus narrowing down the pigments available for restoration and refinement by region.
The Technical: How does the UV Spectrophotometer Work?
To accurately conduct analysis using UV Spectroscopy, the sample needs to be prepared properly and placed in the machine correctly. Starting with sample preparation, a common method used is serial dilution. Serial dilution is used for two purposes: 1) to allow there to be enough volume present to fill the cuvette and 2) to create a sample that can be accurately analyzed by the machine (Spectrophotometry Handbook, n.d.). It helps the accuracy of the analysis because a highly concentrated sample requires a light source to be strong enough to provide a detectable transmittance, so creating a less concentrated sample allows the incident light to be of enough strength for detectable transmittance and absorption (Spectrophotometry Handbook).
Specifically, performing a serial dilution depends on the desired dilution factor. If a 1:100 dilution is wanted, one unit of volume of the concentrated sample is placed into a test tube followed by 99 units of volume of the diluent. This new sample can be used for another 1:100 dilution by combining 1 unit of volume of the new sample and 99 units of volume of the diluent in another test tube resulting in a dilution of 1:10,000. The way to calculate the final dilution factor is using the formula: Final Dilution Factor=DF1 x DF2 x DF3 … etc. (Spectrophotometry Handbook, n.d.).
When using a spectrophotometer, error can be reduced by minimizing light scatter or inaccurate absorptions. Blanking the machine is a method in which the solvent or any undesired reagent is used as the 0-absorption reference so that it does not interfere with the sample’s absorption (Instruments, S. S., 2019). Ensuring the cuvette is not dirty or damaged allows some light scatter to be avoided. Cuvettes that are dirty or damaged can cause absorption at 320 nm which should not be considered as an absorption range for the sample being analyzed (Spectrophotometry Handbook, n.d.).
The UV spectrophotometer takes advantage of Beer’s Law, the fundamental law governing light absorption (Instruments, S. S., 2019). Beer’s law is given by the following equation,
,
where is the absorbance of the sample, is the molar extinction coefficient of the absorbing species, is the path length traveled by the light beam through the sample, and is the concentration of the absorbing species (Instruments, S. S., 2019). The interaction between light and matter is fascinating – since energy is quantized, only light of an energy matching a possible electronic transition within a molecule can be absorbed (UV-Visible Spectroscopy, n.d.). When the molecule absorbs this energy, a particular electron is promoted to an excited state; the electron then returns to its ground state, releasing energy as light or heat (UV-Visible Spectroscopy, n.d.). As such, light released in this process is of a lower energy, and therefore longer wavelength, than the light used to excite the electron (UV-Visible Spectroscopy, n.d.).
In a UV spectrophotometer, light of a wavelength in the ultraviolet region is shined through a sample. The machine records both the wavelengths of light absorbed and the degree to which light at each wavelength was absorbed (Instruments, S. S., 2019). The final spectrum presents a graph of absorbance versus wavelength; referring back to Beer’s Law, the absorbance can be used to quantify the concentration of a sample in solution (Instruments, S. S., 2019).
The Technical: UV Spectroscopy Analysis
Once the UV-Vis procedure has been completed, the results resemble a periodic function with waves and troughs. Such graphs, come as a result of the sample being treated with radiation of a series of wavelengths. The machine detector specifically recognizing wavelengths absorbed and to what extent absorption takes place. The graph can have as many as one peak or several dozen, depending on the molecular structure of the sample (“Interpreting Ultraviolet Spectra- The Effect of Conjugation”, 2015).
Once the graph is generated, it can be replicated a few times with a few different concentrations to create a calibration curve that takes the amount of light absorbed (absorbance) and plots it against concentration of the solution to see at what extent absorbance will change as the solution is made more or less dense. (Ultraviolet-Visible (UV-Vis) Spectroscopy | Protocol, n.d.). This becomes very important when the exact concentration of a sample is not known, such as an experiment that analyzes the degradation of certain species in a reaction over time. When comparing a set of samples, it is common to overlay the values and normalize them. The normalization process requires that all values within the curve are divided by the peak absorbance such that the highest absorbance is normalized to 1 and relative changes in the peaks are easier to enumerate through use of percentages (“UV-Vis Tutorial”, 2017). Peaks that are smaller in size are considered “blue shifted” versus longer wavelengths are considered “red shifted” for the relative sizes of blue and red on the visible spectrum.
One of the key characteristics of interest is the wavelength max. The wavelength max is the wavelength of light for which the sample observes the maximum amount of light. At this same point, it is also noteworthy to recognize the absorbance (“UV-Visible Spectroscopy”, 2017). Traditionally, the machine itself is able to calculate the absorbance by dividing the intensity of light before passing through the sample by the intensity of light after passing through the sample and then taking the natural log of the quotient.
UV-Vis is an incredibly useful technology with many unique applications; however, instrumental analysis reveals some limitations. UV/vis spectroscopy requires pure analytes in order to most accurately determine the absorption spectrum of a sample. However, if samples with multiple detectable compounds are placed into the instrument, then calibrating to detect the presence of the one compound will ultimately result in the other compounds absorbing similar wavelengths. This creates noise in the peaks, raising the limit of quantification, and, in high enough amounts, can render the readout meaningless (Picollo et al., 2018).
Another consideration when utilizing UV/vis spectroscopy results is choosing which radiation source or detector to use for the sample. It is crucial to know the wavelengths of light to look for when trying to identify an analyte because different radiation sources produce different emission ranges (Picollo et al., 2018). Therefore, choosing the right detector affects the sensitivity of the produced results. For example, a Deuterium lamp produces an emission range of 185-400 nm, whereas a Xenon arc lamp produces an emission range of 270-1000 nm (Picollo et al., 2018).
Finally, a crucial limitation of UV/vis spectroscopy is that the technology can identify some analytes better than others. For example, materials that absorb visible light, such as amethyst, ruby, emerald, and paints, are excellent candidates for identification via UV/Vis spectroscopy (Picollo et al., 2018). However, other substances, such as clear diamond, quartz, glass, and some metals are hard to identify using only UV/vis spectroscopy. Thus, UV spectroscopy should be used concurrently with other forms of spectroscopy, such as mass spectroscopy and infrared spectroscopy, in order to fully characterize a compound (Picollo et al., 2018). By utilizing multiple spectroscopy techniques, lower limits of detection and limits of quantification can increase the accuracy of experimental results (Hendel 2014).
References
4.4: UV-Visible Spectroscopy. (2016, July 13). Chemistry LibreTexts.
14.9: Interpreting Ultraviolet Spectra- The Effect of Conjugation. (2015a, May 3). Chemistry LibreTexts.
14.9: Interpreting Ultraviolet Spectra- The Effect of Conjugation. (2015b, May 3). Chemistry LibreTexts.
Abdelhalim, M. A. K., Moussa, S. A. A., & AL-Mohy, Y. H. (2013). Ultraviolet-Visible and Fluorescence Spectroscopy Techniques Are Important Diagnostic Tools during the Progression of Atherosclerosis: Diet Zinc Supplementation Retarded or Delayed Atherosclerosis. BioMed Research International, 2013, 1–8. https://doi.org/10.1155/2013/652604
AgilentSpectroPub4.pdf. (n.d.). Retrieved January 30, 2021, from https://personal.utdallas.edu/~goeckner/plasma_tech_class/AgilentSpectroPub4.pdf
Art_Conservation_UV_Vis.pdf. (n.d.). Retrieved January 31, 2021, from https://www.agilent.com/cs/library/eseminars/public/Art_Conservation_UV_Vis.pdf
Bazin, D., Jouanneau, C., Bertazzo, S., Sandt, C., Dessombz, A., Réfrégiers, M., Dumas, P., Frederick, J., Haymann, J.-P., Letavernier, E., Ronco, P., & Daudon, M. (2016). Combining field effect scanning electron microscopy, deep UV fluorescence, Raman, classical and synchrotron radiation Fourier transform Infra-Red Spectroscopy in the study of crystal-containing kidney biopsies. Comptes Rendus Chimie, 19(11–12), 1439–1450. https://doi.org/10.1016/j.crci.2015.03.001
Binas, V., Stefanopoulos, V., Kiriakidis, G., & Papagiannakopoulos, P. (2019). Photocatalytic oxidation of gaseous benzene, toluene and xylene under UV and visible irradiation over Mn-doped TiO2 nanoparticles. Journal of Materiomics, 5(1), 56–65. https://doi.org/10.1016/j.jmat.2018.12.003
Brown, J. Q., Vishwanath, K., Palmer, G. M., & Ramanujam, N. (2009). Advances in Quantitative UV-Visible Spectroscopy for Clinical and Pre-clinical Application in Cancer. Current Opinion in Biotechnology, 20(1), 119–131. https://doi.org/10.1016/j.copbio.2009.02.004
CELL BIOLOGY/BIOMEDICAL IMAGING: Ultraviolet becomes accessible | Laser Focus World. (n.d.). Retrieved February 5, 2021, from https://www.laserfocusworld.com/biooptics/bioimaging/fluorescence/article/14194597/cell-biologybiomedical-imaging-ultraviolet-becomes-accessible
Chen, X., Yin, G., Zhao, N., Gan, T., Yang, R., Xia, M., Feng, C., Chen, Y., & Huang, Y. (2021). Simultaneous determination of nitrate, chemical oxygen demand and turbidity in water based on UV–Vis absorption spectrometry combined with interval analysis. Spectrochimica Acta Part A: Molecular and Biomolecular Spectroscopy, 244, 118827. https://doi.org/10.1016/j.saa.2020.118827
Cheung, C. C., Martin, B. R., & Asa, S. L. (2013). Defining diagnostic tissue in the era of personalized medicine. CMAJ : Canadian Medical Association Journal, 185(2), 135–139. https://doi.org/10.1503/cmaj.120565
Cook, S., Peacock, M., Evans, C. D., Page, S. E., Whelan, M. J., Gauci, V., & Kho, L. K. (2017). Quantifying tropical peatland dissolved organic carbon (DOC) using UV-visible spectroscopy. Water Research, 115, 229–235. https://doi.org/10.1016/j.watres.2017.02.059
Cosyns, P., Meulebroeck, W., Thienpont, H., & Nys, K. (2012). Potential prospects in archaeological research by using optical spectroscopy through a black glass ocular. Integrated Approaches to the Study of Historical Glass, 8422, 842209. https://doi.org/10.1117/12.981482
Evolution of UV-Vis Spectrophotometers. (n.d.). Lab Manager. Retrieved January 10, 2021, from https://www.labmanager.com/laboratory-technology/evolution-of-uv-vis-spectrophotometers-18481
Ghosh, R. K., Kar, T., Dutta, B., Pathak, A., Rakshit, R., Basak, R., Das, A., Waheeda, K., Basak, P., & Bhattacharyya, M. (2018). Aberration in the structural paradigm of lens protein α crystallin by UV-C irradiation. Applied Biological Chemistry, 61(3), 281–287. https://doi.org/10.1007/s13765-018-0351-y
Guo, Y., Liu, C., Ye, R., & Duan, Q. (2020). Advances on Water Quality Detection by UV-Vis Spectroscopy. Applied Sciences, 10(19), 6874. https://doi.org/10.3390/app10196874
Hagmann, J.-G. (2014). From Leipzig to Harvard – Knowledge transfer in early UV-spectroscopy: From Leipzig to Harvard – Knowledge transfer in early UV-spectroscopy. Annalen Der Physik, 526(1–2), A11–A15. https://doi.org/10.1002/andp.201400802
Howtomakesolnsdilns.pdf. (n.d.). Retrieved January 30, 2021, from https://www.uvm.edu/cosmolab/om/howtomakesolnsdilns.pdf
Hunt, C. D. (1998). Regulation of enzymatic activity. Biological Trace Element Research, 66(1), 205–225. https://doi.org/10.1007/BF02783139
Instruments, S. S. (2019, September 16). UV-Vis Frequently Asked Questions—Light and Theory. https://www.ssi.shimadzu.com/
Laboratory Solutions from METTLER TOLEDO. (2018, November 28). What is UV Vis Spectroscopy? https://www.youtube.com/watch?v=P9iAV-x5y-w
Lee, J., Duan, Q., Bi, S., Luo, R., Lian, Y., Liu, H., Tian, R., Chen, J., Ma, G., Gao, J., & Xu, Z. (2019). Machine Learning Promoting Extreme Simplification of Spectroscopy Equipment. ArXiv:1808.03679 [Physics, Stat]. http://arxiv.org/abs/1808.03679
nanoComposix. (2017, September 11). UV-Vis Tutorial | Part 3: Data Analysis. https://www.youtube.com/watch?v=yRNacc3L5b0
Noelle, A., Vandaele, A. C., Martin-Torres, J., Yuan, C., Rajasekhar, B. N., Fahr, A., Hartmann, G. K., Lary, D., Lee, Y.-P., Limão-Vieira, P., Locht, R., McNeill, K., John J. Orlando, Salama, F., & Wayne, R. P. (2020). UV/Vis+ photochemistry database: Structure, content and applications. Journal of Quantitative Spectroscopy and Radiative Transfer, 253, 107056. https://doi.org/10.1016/j.jqsrt.2020.107056
O’Keeffe, S., Fitzpatrick, C., & Lewis, E. (2007). An optical fibre based ultra violet and visible absorption spectroscopy system for ozone concentration monitoring. Sensors and Actuators B: Chemical, 125(2), 372–378. https://doi.org/10.1016/j.snb.2007.02.023
Principle of UV-Visible Spectroscopy—Detailed Explanation. (n.d.). BYJUS.
Ropret, P., & Madariaga, J. M. (2014). Applications of Raman spectroscopy in art and archaeology: Applications of Raman spectroscopy in art and archaeology. Journal of Raman Spectroscopy, 45(11–12), 985–992. https://doi.org/10.1002/jrs.4631
Schmid, F.-X. (2001). Biological Macromolecules: UV-visible Spectrophotometry. In ELS. American Cancer Society. https://doi.org/10.1038/npg.els.0003142
Sharma, V., Kumar, R., & Kaur, P. (2019). Forensic Examination of Textile Fibers Using UV-Vis Spectroscopy Combined with Multivariate Analysis. Journal of Applied Spectroscopy, 86(1), 96–100. https://doi.org/10.1007/s10812-019-00787-4
Spectrophotometry Handbook. (n.d.). 32.
The Central Role of Enzymes as Biological Catalysts—The Cell—NCBI Bookshelf. (n.d.). Retrieved February 3, 2021, from https://www.ncbi.nlm.nih.gov/books/NBK9921/
The History of Spectrophotometry. (n.d.). Sciencing. Retrieved February 1, 2021, from https://sciencing.com/history-spectrophotometry-6595173.html
Ultraviolet-Visible (UV-Vis) Spectroscopy | Protocol. (n.d.). Retrieved January 24, 2021, from https://www.jove.com/v/10204/ultraviolet-visible-uv-vis-spectroscopy
UV-Visible Spectroscopy. (n.d.). Retrieved January 10, 2021, from https://www2.chemistry.msu.edu/faculty/reusch/virttxtjml/spectrpy/uv-vis/spectrum.htm
UV-visible-NIR reflectance spectrophotometry in cultural heritage: Background paper. (2016). Analytical Methods, 8(30), 5894–5896. https://doi.org/10.1039/C6AY90112C
Related Posts
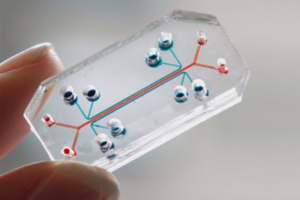
Advancements in Regenerative Medicine – Unleashing the Potential of Artificial Organs and Organs-on-a-Chip
Source: 허동은교수, Wikimedia Commons, CC BY-SA 4.0 Introduction Recent years...
Read More
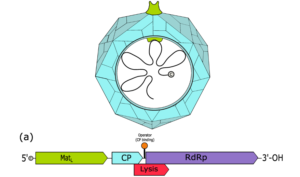
The Next Source of Antibiotics: Viruses
Figure 1: A computer-generated image of a bacteriophage called a...
Read MoreNishi Jain, Daniela Galvez-Cepeda, Katherine Faulkner, Sonia Fung, Alexandra McOsker, Sarah Matatov, Arooba Ahmed, Lina Lew, Maria Clara Trajano, Sreya Roy, Carolina Guerrero, Anahita Kodali, Maeen Arslan, Aadhishre Kasatsh,