Data Analysis of Global Covid Vaccination (7 March to 4 April 2022)

Figure: In this map, the color shows the sum of Total Vaccination per 100 persons from 7 March to 4 April 2022. The size shows the count of vaccinations. (Data Source: World Health Organization Website; Data Visualization: Tableau)

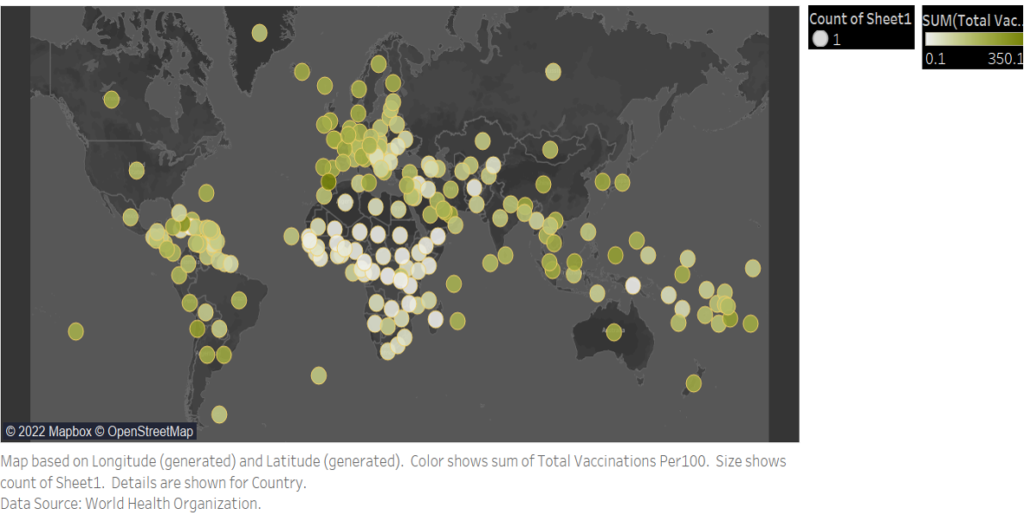
The famous Dutch philosopher Desiderius Erasmus once stated that “prevention is better than cure” – wise words that the modern public health community holds sacred. In the current pandemic, vaccination is integral for slowing down the spread of COVID-19 and restricting its effects on the economy (BBVA, 2021). It is necessary for the Governments worldwide to achieve as full vaccination as possible to be prepared for the upcoming wave of the disease. At least two doses of vaccination are required for each person to reach the total vaccination mark. While some countries have an excellent vaccination rate, other countries are clearly below the mark. For example, United Arab Emirates has the highest vaccination percentage with 99 % whereas Nigeria has only a 13 % total vaccination rate (Ritchie et al., 2022). Cuba has the highest vaccination doses administered with 329.96 followed by Chile with 298.07 as of 4 June 2022 (Ritchie et al., 2022). Globally, 11.86 billion doses have been administered, but only 16.2% of people have received at least one dose of the vaccine in low-income countries. As this figure suggests, vaccination rates greatly vary across the globe (Figure 1).

At this point in the pandemic, the United States has the highest number of reported COVID-19 cases with 83,475,439. India and Brazil stand next in the line with 43,160,832 and 31,019,038 total COVID-19 cases respectively as of June 2022 (BBC,2022). Continuing efforts to boost vaccination can help limit the number of additional cases, and allow for those who are infected to come away with a more minor case of the disease. Vaccines are beneficial because they reduce hospitalizations and increase immunity. Though a person might still become infected by a disease, vaccination reduces the severity of the disease and its repercussions are expected to be less (Quilici et al., 2015).

Economically, investment in vaccination programs brings long-term positive returns for governments. Health is directly related to the productivity of a country (Quilici et al., 2015). Good health is an asset as it can drive higher income through education, labor productivity, investments, and savings. In addition, improvement in healthcare is mainly dependent on prevention (Quilici et al., 2015). For instance, vaccinations protect or slow down the progress of spreading diseases. A healthy population indulges in better education, increased productivity, and economic development.In this sense, Governments investing in vaccination campaigns will have returns in long run, thereby improving public healthcare. In addition, a healthier and better-educated population can attract more foreign investment and create employment and capital accumulation (Barnighausen et al., 2014).

This paper provides data analysis of the Total Global COVID-19 Vaccinations from 7 March to 4 April. Additionally, it endeavors to display the variations in the vaccination drives worldwide and the importance of vaccination.

Methodology

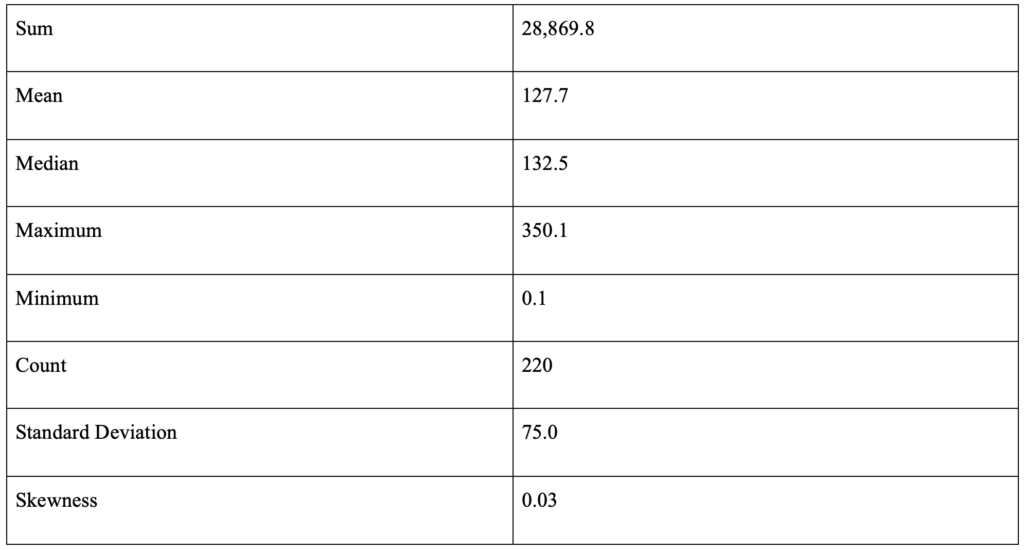
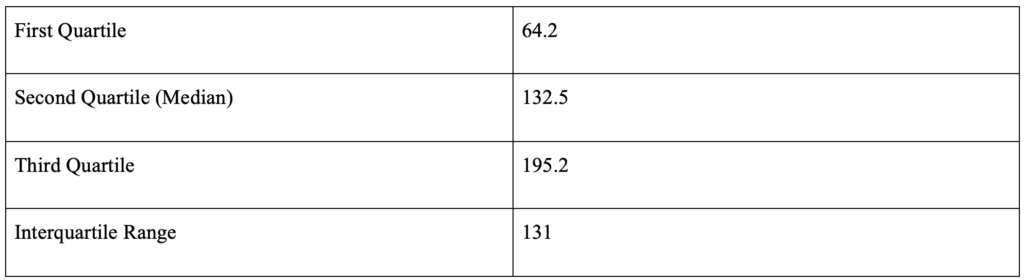
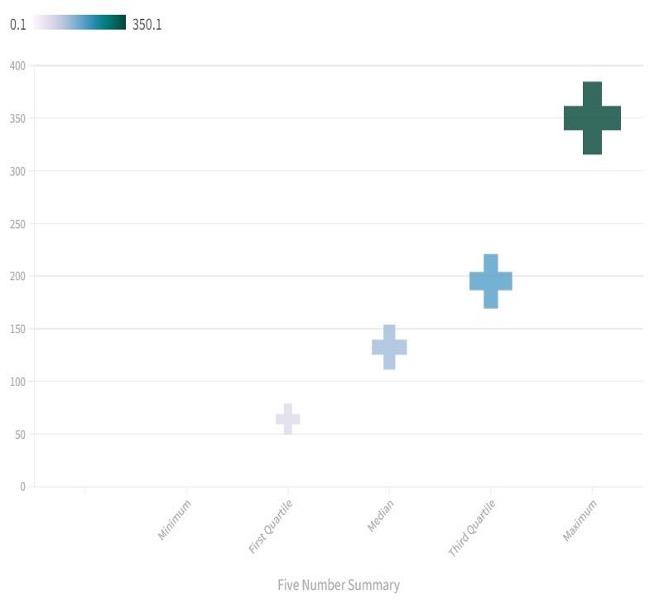
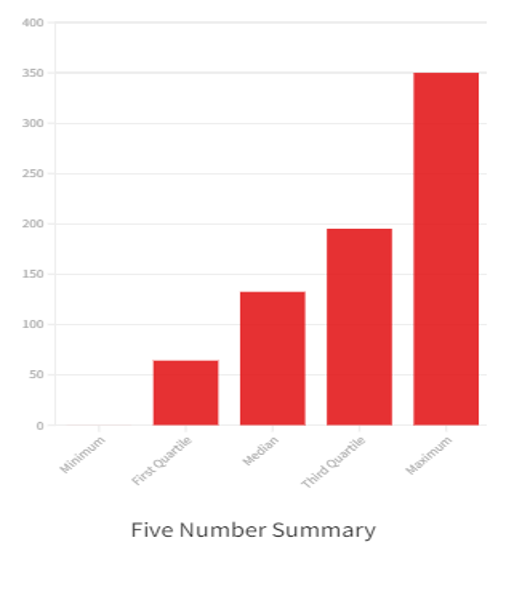
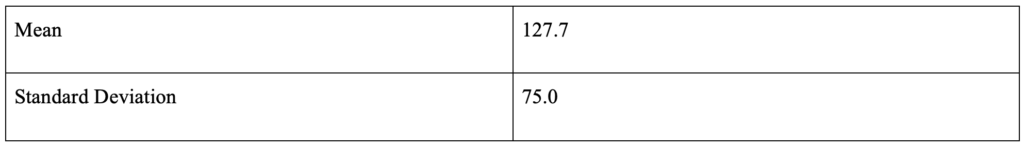
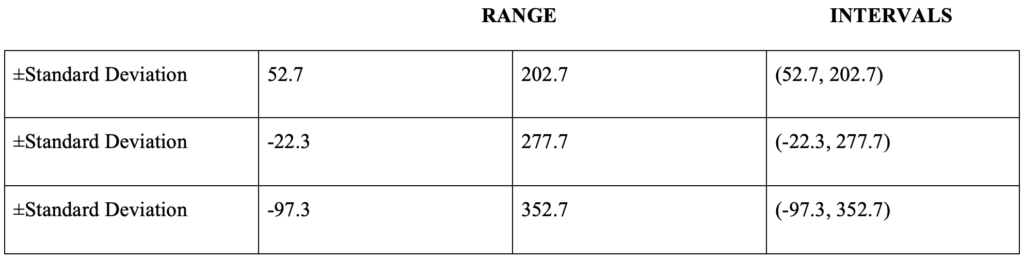
Data collection was the first step in the data analysis process. The data has been collected from the World Health Organization website d. In this study, descriptive analysis was used to evaluate vaccination rates from March 7th to April 4th, 2022. These dates were chosen to analyze the data which will inform the readers about the recent variations in total global COVID-19 vaccination for this stage of the pandemic. The five-number summary, mean, standard deviation, and distribution variation have been calculated in Microsoft Excel. For the data visualization maps and graphs, Tableau and Flourish software have been used.

Results and Discussions

A.DESCRIPTIVE STATISTICS

Table 1 displays the numeric value for Descriptive Statistics.

The mean for total global COVID-19 vaccinations from 7 March to 4 April is 127.7 and the median is 132.5. In the analyzed dataset, the mean and median are not equal but very similar, suggesting that the data is only slightly skewed.

ANALYSIS OF QUARTILES

Table 2 displays the numerical values of Quartiles.

The quartiles split the values of the dataset into 4 equal parts. The values of the first, second, and third quartiles as calculated with the help of the intermediate calculations are 64.2, 132.5, and 195.2

The main purpose of calculating the quartiles is to find out the interquartile range. The interquartile range (IQR) is the distance between the first and third quartiles and is a concise measure of the variability around the median. More specifically, the IQR tells us the range of the middle half of the data. Therefore, it is not influenced by extreme values and is a resistant measure. In the user data, the IQR is 131 and the interval 64.2 to 195.2 is referred to as the middle fifty.

FIVE NUMBER SUMMARY

In Table 3 the numeric details of the Five Number Summary have been provided.

Created in Tableau

Created in Flourish

Created in Flourish

The five-number summary [Table.3] for a variable consists of the smallest value (minimum), the first quartile, the median, the third quartile, and the largest value (maximum). The five-number summary provides a way to determine the shape of the distribution for a set of data. 

We observe that the distance from the minimum to the median (132.5) is less than the distance from the median to the maximum (350.1). Further, the distance from minimum to Q1 (4.2) is slightly less than the distance from Q3 (195.2) to the maximum. This implies that the data is slightly right-skewed. We can observe that this result corroborates with our early analysis undertaken in descriptive statistics.

D.VARIABLILITY IN DISTRIBUTION:

Table 4

D.1.RESULTS:

In Table.5, the numerical values of the range and intervals of standard deviation has been displayed.

Since the distribution may be skewed (it is right-skewed, as determined earlier), we will not use the empirical rule. The empirical rule is used in statistics to forecast the final outcome. Hence, we use Chebychev’s Rule in this data. According to Chebychev’s Rule Using, whatever may be the shape of a distribution, at least 75 percent of the values in the population will fall within ± 2 standard deviations of the mean and at least 89 percent will fall within ± 3 standard deviations from the mean. Using that, we conclude that nothing can be said about the percentage of countries lying between 52.7 and 202.7 percent of the Global COVID 19 Vaccination. We can further state that at least 75% of the countries will have a Vaccination percentage output growth (Vaccination percentage output growth is the rate at which vaccination will increase in a period of time) between -22.3 and 277.7 % and at least 88.89% of the countries will have a Vaccination percentage output growth between -97.3 and 352.7%.

Conclusion

From the above data, it can be concluded that while few countries have performed brilliant vaccination drives few countries to need to accelerate the implementation of their vaccination schemes. Therefore, it becomes essential for policymakers to come up with efficient ways of vaccination to improve public healthcare and increase economic growth.

References

  1. WHO COVID-19 Dashboard. Geneva: World Health Organization, 2020. Available online: https://covid19.who.int/ (last cited: [4 April 2022]).
  2. Quilici, S., Smith, R., & Signorelli, C. (2015). Role of vaccination in economic growth. Journal of market access & health policy, 3, 10.3402/jmahp.v3.27044. https://doi.org/10.3402/jmahp.v3.27044
  3. The importance and benefits of getting vaccinated against COVID-19”. BBVA, 31 Aug 2021.https://www.bbva.com/en/the-importance-and-benefits-of-getting-vaccinated-against-covid-19/
  4. Covid map: Coronavirus cases, deaths, vaccinations by country”, BBC, 1 June 2022.                              https://www.bbc.com/news/world-51235105
  5. Hannah Ritchie, Edouard Mathieu, Lucas Rodés-Guirao, Cameron Appel, Charlie Giattino, Esteban Ortiz-Ospina, Joe Hasell, Bobbie Macdonald, Diana Beltekian and Max Roser (2020) – “Coronavirus Pandemic (COVID-19)”. Published online at OurWorldInData.org. Retrieved from: ‘https://ourworldindata.org/coronavirus’ [Online Resource].    “Coronavirus (COVID-19) Vaccinations”, Oxford Martin School, 5 June 2022. https://ourworldindata.org/covid-vaccinations
  6. Barnighausen T, Bloom DE, Cafiero-Fonseca ET, O’Brien JC. Valuing vaccination. Proc Natl Acad Sci USA. 2014; 111(34): 12313–9.  [Google Scholar]

Related Posts

Drishti Hajong