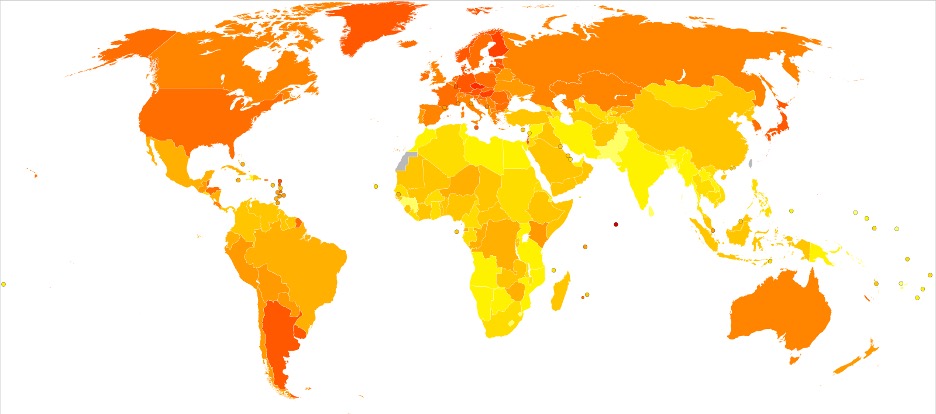
Figure 1: A map showing relative rates of pancreatic cancer across the globe. The darker the color, the higher the rate. 55% of the world’s cases come from developed countries because pancreatic cancer’s risk factors include obesity, smoking, and diabetes.
Image retrieved from Wikipedia Commons
In recent years, mapping the rate of disease spread across the world has become a fast-growing field of medical research because it reveals important information through inference: potential risk factors, probable genetic dispositions, and even likely solutions to. The resulting maps, an example of which is shown above, show relative rates of disease in various regions. So-called “disease atlases” are instrumental in epidemiology and cancer research, but have primarily been limited by “plug-and-chug” methods of data analysis, with data scientists taking recorded data and manually plotting them on a map.3 Researchers at Queensland University of Technology have developed a new method of mathematical modeling that uses the idea of geographic remoteness (defined by physical isolation and service accessibility) to get more information from pre-existing disease atlases, generate a map, and analyze epidemiology without needing to conduct further research or use original, un-scrubbed data.1
The problem first arose when head researcher PhD student Farzana Jahan wanted to analyze some information previously published by other researchers but found that it was virtually impossible to conduct new analyses because all medical info must be “scrubbed,” or cleared of any identifying or sensitive information. This kind of censoring is common practice to protect patient confidentiality, but it can be a headache for researchers. Therefore, Ms. Jahan and her team started making a mathematical model based on Bayesian statistics that is able to take the scrubbed records and make further inferences.1
The Queensland researchers employed their Bayesian meta-analysis model to analyze statistics on 20 types of cancers found and recorded in disease atlases of Australia. Meta-analysis is a form of statistical analysis that quantitatively combines aggregate or summary data from different studies. Bayesian inference itself is a form of statistics where probability is defined as a degree of belief or confidence in an event. For reference, classical statistics defines probability as the frequencies of an event occurring in repeated, randomized trials. The predicted results were validated by comparing each model with recorded unit-level analysis available in the country’s cancer registry. The team found that their model was able to replicate the unit-level analysis (i.e. data that was already manually recorded by doctors and hospitals across Australia) and provide new insights into each cancer’s expression rate based on remoteness.
As mentioned earlier, remoteness was defined by both geographic remoteness and service accessibility, and disease cases were divided into three categories along these lines: major cities, regional areas, and remote areas. The study found that major cities were more likely to have greater a greater incidence of cancers afflicting the brain, skin, pancreas, stomach, and thyroid, among others, whereas other cancers more likely to affect regional areas included skin, prostate, leukemia, and kidney cancer.3
There are many advantages of this model, including no longer having to depend upon the availability of un-scrubbed patient data to conduct research and the ability to make previously unseen inferences and connections, as disease atlases are frequently only adjusted for age and population size.1 And this new model can be used to undertake many sociological questions as well, such as: does distance from a radiology clinic impact outcomes? How does access to cheap, fresh fruits and vegetables from a well-stocked grocery affect outcomes? How about quality of education or socioeconomic status? In the future, the techniques developed in this study can be applied to the mapping of different diseases, such as mental illnesses, autoimmune diseases, or chronic pain. Understanding more about the geographical regions in which certain diseases occur can give doctors, public policy makers, and others the ability to rectify and address the structural deficiencies leading to higher rates of sickness in certain regions.
References
- Cancer mapping may solve puzzle of regional disease links. ScienceDaily. (2020). Retrieved 21 August 2020, from https://www.sciencedaily.com/releases/2020/08/200813103121.htm.
- Countries With The Highest Incidence Of Pancreatic Cancer In The World. World Atlas. (2020). Retrieved 21 August 2020, from https://www.worldatlas.com/articles/countries-with-the-highest-incidence-of-pancreatic-cancer-in-the-world.html.
- Jahan, F., Duncan, E., Cramb, S., Baade, P., & Mengersen, K. (2020). Augmenting disease maps: a Bayesian meta-analysis approach. Royal Society Open Science, 7(8), 192151. https://doi.org/10.1098/rsos.192151
Related Posts
Rethinking ‘Junk’ DNA: The Vital Role DNA Repeats Play in Cancer and Aging
Figure: The image above, created by the National Institutes of...
Read MoreFighting Hospital Hardships: An Intervention for Reducing Stress in Hospital Workers
Figure 1: This figure describes some of the symptoms of...
Read MoreHuman Endogenous Retroviruses Might Unlock a New Field of Neurodegenerative Disease Research
Figure 1: Researchers have found viral genetic materials within the...
Read MoreLove Tsai


